
Dynamic charts
When we need to display some charts, we might use simple and fast library – HighCharts.Which I’ll try to explain brefly below.
Example
In our example we display column chart and linear plot. We will need to this : JQuery, HighCharts scripts.You can also download it from nuget package.
At the begining we generate pseudorandom numbers from 3k-10k it mean salary in each month.
Random rand = new Random();
object[] randomValue = new object[12];
for (int i = 0; i < 12; i++)
{
    randomValue[i] = rand.Next(3000, 10000);
}
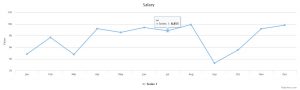
Now we create our chart.
DotNet.Highcharts.Highcharts chart = new DotNet.Highcharts.Highcharts("chart")
    .SetTitle(new Title
    {
        Text = "Salary"
    })
    .SetYAxis(new YAxis
    {
        Title = new YAxisTitle
        {
            Text = "Value"
        }
    })
    .SetXAxis(new XAxis
    {
        Categories = new[] { "Jan", "Feb", "Mar", "Apr", "May", "Jun", "Jul", "Aug", "Sep", "Oct", "Nov", "Dec" }
    })
    .SetSeries(new Series
    {
        Data = new Data(randomValue)

    });
The first lines should be clear. In function SetXAxis we creat Categories.In our case – month. In SetSeries() we pass pseudorandom salary.
Pass model to view.
return View(chart);
And the view is as
@model DotNet.Highcharts.Highcharts
<script src="~/Scripts/jquery-3.1.1.js"></script>
<script src="~/Scripts/Highcharts-4.0.1/js/highcharts.js"></script>
@(Model)
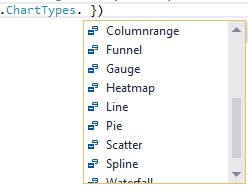
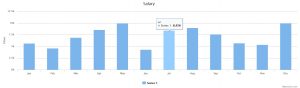
And now the same but with column chart.
The difference in the code is just this line:
.InitChart(new Chart { Type = DotNet.Highcharts.Enums.ChartTypes.Column })
As you can see we have a lot of options presentations charts.
And it look like:
Summary
I showed you just the tip of the iceberg. This library is much more powerful and as you see easy to use.
Link to the project: here